Joe D
Registered User
<table align="center" border="0" cellpadding="3" cellspacing="3" width="750"> <tbody><tr> <td align="center"> <table border="0" cellpadding="2" width="100%"> <tbody><tr> <td>
</td> <td align="center"> <table align="center" border="0" cellpadding="2" cellspacing="1" width="100%"> <tbody><tr> <td class="sansnavyb6x" align="center">West Branch Susquehanna River & Susquehanna River</td> </tr> <tr> <td align="center">
</td> </tr> <tr> <td class="sansb5x" align="center">July 13-17 and 23-25, 2009</td> </tr> <tr> <td class="sansb5x" align="center">Sampling Technique – Backpack Electrofishing</td> </tr> </tbody></table></td> </tr> </tbody></table></td> </tr> <tr> <td width="100%"><hr size="1"></td> </tr> <tr> <td align="left" width="100%">Division of Fisheries Management staff from Areas 3, 4, 6, and 7 annually evaluate the level of smallmouth bass reproduction during summer in the West Branch Susquehanna (West Branch) and Susquehanna rivers. Since 2005, these surveys have also been used to assess the prevalence of the disease condition that has been affecting young-of-year (YOY) smallmouth bass residing in the Susquehanna River system. Biologists conducted backpack electrofishing surveys July 13-17 and 23-24, 2009 targeting YOY smallmouth bass at ten historic sampling sites in the West Branch and twenty-six historic sampling sites in the Susquehanna River. The main stem Susquehanna River is addressed as three reaches, the “North Branch” reach upstream of Sunbury, the middle reach from the Fabri-dam near Sunbury downstream to York Haven Dam, and the lower reach from York Haven Dam downstream to the Maryland border. A more focused description of YOY smallmouth bass and walleye surveys for 2009 in the North Branch reach of the Susquehanna River can be found here.
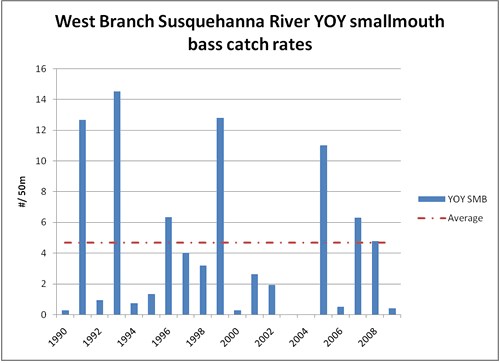
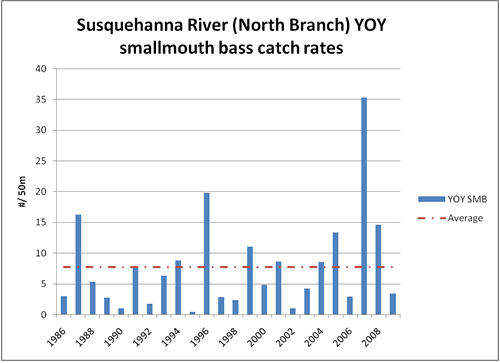
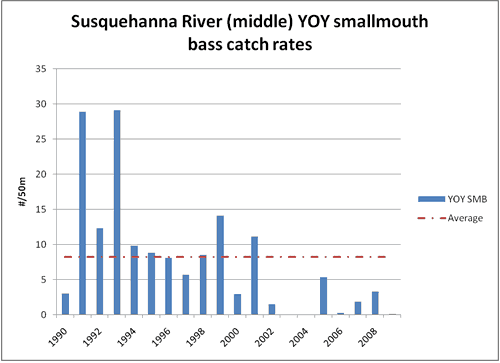
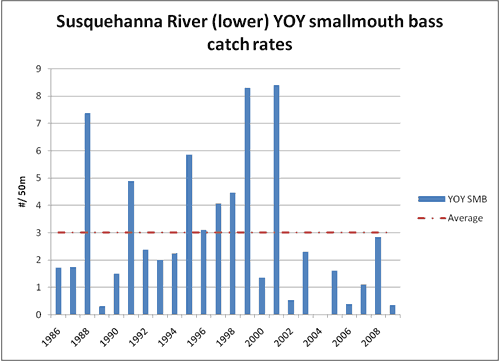
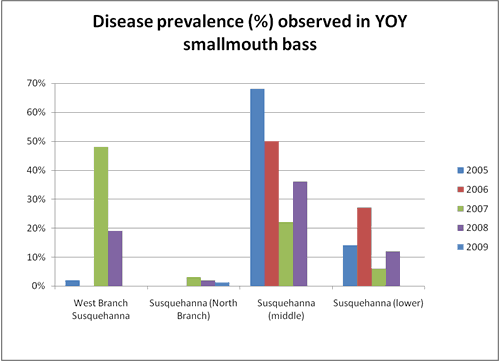
During 2009, catch rates (number of fish captured per 50 meters) varied between the West Branch Susquehanna and the Susquehanna rivers and among reaches of the Susquehanna River, and were below the historic averages for all reaches (Table 1, Figures 1-4). Disease prevalence among YOY smallmouth bass captured during 2009 was low. Approximately 1% of fish captured showed signs of the disease condition (Table 2, Figure 5).
TABLE 1. Catch rates (number captured per 50 meters) of young-of-year smallmouth bass captured during directed surveys conducted during July 2009 at the West Branch Susquehanna and Susquehanna river.
<table align="center" border="1" cellpadding="3" cellspacing="0"> <tbody><tr class="graymed"> <td align="center" nowrap="nowrap" valign="bottom">Water</td> <td align="center" valign="bottom">Catch rate
(#/ 50m)</td> <td align="center" valign="bottom">Historic average
catch rate</td> </tr> <tr> <td align="left" nowrap="nowrap">West Branch Susquehanna River</td> <td align="center" nowrap="nowrap">0.41</td> <td align="center" nowrap="nowrap">4.7</td> </tr> <tr> <td align="left" nowrap="nowrap">"North Branch" Susquehanna River</td> <td align="center" nowrap="nowrap">3.41</td> <td align="center" nowrap="nowrap">7.7</td> </tr> <tr> <td align="left" nowrap="nowrap">Susquehanna River (middle)</td> <td align="center" nowrap="nowrap">0.15</td> <td align="center" nowrap="nowrap">8.2</td> </tr> <tr> <td align="left" nowrap="nowrap">Susquehanna River (lower)</td> <td align="center" nowrap="nowrap">0.33</td> <td align="center" nowrap="nowrap">3.0</td> </tr> <tr> <td align="left" nowrap="nowrap">All reaches</td> <td align="center" nowrap="nowrap">1.08</td> <td align="center" nowrap="nowrap">5.9</td> </tr> </tbody></table>
*Please note differences in scale of the graphics
*Please note differences in scale of the graphics
*Please note differences in scale of the graphics TABLE 2. Annual disease prevalence observed in Susquehanna River YOY smallmouth bass by reach since discovery of condition.
<table style="border-collapse: collapse;" align="center" border="1" cellpadding="3" cellspacing="0"> <tbody><tr class="graymed"> <td align="center" nowrap="nowrap" valign="bottom">Year</td> <td align="center" valign="bottom">West Branch
Susquehanna River</td> <td align="center" valign="bottom">"North Branch"
Susquehanna River</td> <td align="center" valign="bottom">Susquehanna
River (middle)</td> <td align="center" valign="bottom">Susquehanna
River (lower)</td> <td align="center" nowrap="nowrap" valign="bottom">All
reaches</td> </tr> <tr> <td align="center" nowrap="nowrap">2005</td> <td align="center" nowrap="nowrap">2%</td> <td align="center" nowrap="nowrap">0%</td> <td align="center" nowrap="nowrap">68%</td> <td align="center" nowrap="nowrap">14%</td> <td align="center" nowrap="nowrap">21%</td> </tr> <tr> <td align="center" nowrap="nowrap">2006</td> <td align="center" nowrap="nowrap">0%</td> <td align="center" nowrap="nowrap">0%</td> <td align="center" nowrap="nowrap">50%</td> <td align="center" nowrap="nowrap">27%</td> <td align="center" nowrap="nowrap">19%</td> </tr> <tr> <td align="center" nowrap="nowrap">2007</td> <td align="center" nowrap="nowrap">48%</td> <td align="center" nowrap="nowrap">3%</td> <td align="center" nowrap="nowrap">22%</td> <td align="center" nowrap="nowrap">6%</td> <td align="center" nowrap="nowrap">20%</td> </tr> <tr> <td align="center" nowrap="nowrap">2008</td> <td align="center" nowrap="nowrap">19%</td> <td align="center" nowrap="nowrap">2%</td> <td align="center" nowrap="nowrap">36%</td> <td align="center" nowrap="nowrap">12%</td> <td align="center" nowrap="nowrap">17%</td> </tr> <tr> <td align="center" nowrap="nowrap">2009</td> <td align="center" nowrap="nowrap">0%</td> <td align="center" nowrap="nowrap">1%</td> <td align="center" nowrap="nowrap">0%</td> <td align="center" nowrap="nowrap">0%</td> <td align="center" nowrap="nowrap">1%</td> </tr> </tbody></table>
 Reproduction rates of smallmouth bass in river systems are highly variable and are largely controlled by abiotic factors such as stream flow during and shortly after the spawning period. Literature suggests that high stream flows during June and July often result in poor year classes while low flow during that same time period often results in good year classes. The West Branch and main stem Susquehanna rivers experienced high flow conditions during June (about 25% above normal) and July (about 15% above normal) and was likely the primary factor affecting low catch rates during 2009.
Adult smallmouth bass surveys in coming years will give further indication of how the 2009 year class recruits to the older age classes and contributes to the adult smallmouth bass populations of the West Branch and main stem Susquehanna rivers.
</td> </tr> <tr> <td align="right" width="100%">
</td> </tr> <tr> <td align="right" width="100%">– Geoff Smith, Susquehanna River Biologist</td> </tr> <tr> <td align="center" width="100%"><hr size="1">
<hr size="1"></td> </tr> <tr> <td align="center" width="100%">
</td> </tr> <tr> <td align="center" width="100%">
</td> </tr> <tr> <td align="center">
</td> </tr> </tbody></table>
</td> <td align="center"> <table align="center" border="0" cellpadding="2" cellspacing="1" width="100%"> <tbody><tr> <td class="sansnavyb6x" align="center">West Branch Susquehanna River & Susquehanna River</td> </tr> <tr> <td align="center">
</td> </tr> <tr> <td class="sansb5x" align="center">July 13-17 and 23-25, 2009</td> </tr> <tr> <td class="sansb5x" align="center">Sampling Technique – Backpack Electrofishing</td> </tr> </tbody></table></td> </tr> </tbody></table></td> </tr> <tr> <td width="100%"><hr size="1"></td> </tr> <tr> <td align="left" width="100%">Division of Fisheries Management staff from Areas 3, 4, 6, and 7 annually evaluate the level of smallmouth bass reproduction during summer in the West Branch Susquehanna (West Branch) and Susquehanna rivers. Since 2005, these surveys have also been used to assess the prevalence of the disease condition that has been affecting young-of-year (YOY) smallmouth bass residing in the Susquehanna River system. Biologists conducted backpack electrofishing surveys July 13-17 and 23-24, 2009 targeting YOY smallmouth bass at ten historic sampling sites in the West Branch and twenty-six historic sampling sites in the Susquehanna River. The main stem Susquehanna River is addressed as three reaches, the “North Branch” reach upstream of Sunbury, the middle reach from the Fabri-dam near Sunbury downstream to York Haven Dam, and the lower reach from York Haven Dam downstream to the Maryland border. A more focused description of YOY smallmouth bass and walleye surveys for 2009 in the North Branch reach of the Susquehanna River can be found here.
During 2009, catch rates (number of fish captured per 50 meters) varied between the West Branch Susquehanna and the Susquehanna rivers and among reaches of the Susquehanna River, and were below the historic averages for all reaches (Table 1, Figures 1-4). Disease prevalence among YOY smallmouth bass captured during 2009 was low. Approximately 1% of fish captured showed signs of the disease condition (Table 2, Figure 5).
TABLE 1. Catch rates (number captured per 50 meters) of young-of-year smallmouth bass captured during directed surveys conducted during July 2009 at the West Branch Susquehanna and Susquehanna river.
<table align="center" border="1" cellpadding="3" cellspacing="0"> <tbody><tr class="graymed"> <td align="center" nowrap="nowrap" valign="bottom">Water</td> <td align="center" valign="bottom">Catch rate
(#/ 50m)</td> <td align="center" valign="bottom">Historic average
catch rate</td> </tr> <tr> <td align="left" nowrap="nowrap">West Branch Susquehanna River</td> <td align="center" nowrap="nowrap">0.41</td> <td align="center" nowrap="nowrap">4.7</td> </tr> <tr> <td align="left" nowrap="nowrap">"North Branch" Susquehanna River</td> <td align="center" nowrap="nowrap">3.41</td> <td align="center" nowrap="nowrap">7.7</td> </tr> <tr> <td align="left" nowrap="nowrap">Susquehanna River (middle)</td> <td align="center" nowrap="nowrap">0.15</td> <td align="center" nowrap="nowrap">8.2</td> </tr> <tr> <td align="left" nowrap="nowrap">Susquehanna River (lower)</td> <td align="center" nowrap="nowrap">0.33</td> <td align="center" nowrap="nowrap">3.0</td> </tr> <tr> <td align="left" nowrap="nowrap">All reaches</td> <td align="center" nowrap="nowrap">1.08</td> <td align="center" nowrap="nowrap">5.9</td> </tr> </tbody></table>
Figure 1. Historic catch rates (#/50 meters) of YOY smallmouth bass captured during directed surveys at the West Branch.

Figure 2. Historic catch rates (#/50 meters) of YOY smallmouth bass captured during directed surveys at the Susquehanna River upstream of Sunbury (North Branch).

*Please note differences in scale of the graphics
Figure 3. Historic catch rate (#/50 meters) of YOY smallmouth bass captured during directed surveys at the middle Susquehanna River.

*Please note differences in scale of the graphics
Figure 4. Historic catch rates (#/50 meters) of YOY smallmouth bass captured during directed surveys at the lower Susquehanna.

*Please note differences in scale of the graphics
<table style="border-collapse: collapse;" align="center" border="1" cellpadding="3" cellspacing="0"> <tbody><tr class="graymed"> <td align="center" nowrap="nowrap" valign="bottom">Year</td> <td align="center" valign="bottom">West Branch
Susquehanna River</td> <td align="center" valign="bottom">"North Branch"
Susquehanna River</td> <td align="center" valign="bottom">Susquehanna
River (middle)</td> <td align="center" valign="bottom">Susquehanna
River (lower)</td> <td align="center" nowrap="nowrap" valign="bottom">All
reaches</td> </tr> <tr> <td align="center" nowrap="nowrap">2005</td> <td align="center" nowrap="nowrap">2%</td> <td align="center" nowrap="nowrap">0%</td> <td align="center" nowrap="nowrap">68%</td> <td align="center" nowrap="nowrap">14%</td> <td align="center" nowrap="nowrap">21%</td> </tr> <tr> <td align="center" nowrap="nowrap">2006</td> <td align="center" nowrap="nowrap">0%</td> <td align="center" nowrap="nowrap">0%</td> <td align="center" nowrap="nowrap">50%</td> <td align="center" nowrap="nowrap">27%</td> <td align="center" nowrap="nowrap">19%</td> </tr> <tr> <td align="center" nowrap="nowrap">2007</td> <td align="center" nowrap="nowrap">48%</td> <td align="center" nowrap="nowrap">3%</td> <td align="center" nowrap="nowrap">22%</td> <td align="center" nowrap="nowrap">6%</td> <td align="center" nowrap="nowrap">20%</td> </tr> <tr> <td align="center" nowrap="nowrap">2008</td> <td align="center" nowrap="nowrap">19%</td> <td align="center" nowrap="nowrap">2%</td> <td align="center" nowrap="nowrap">36%</td> <td align="center" nowrap="nowrap">12%</td> <td align="center" nowrap="nowrap">17%</td> </tr> <tr> <td align="center" nowrap="nowrap">2009</td> <td align="center" nowrap="nowrap">0%</td> <td align="center" nowrap="nowrap">1%</td> <td align="center" nowrap="nowrap">0%</td> <td align="center" nowrap="nowrap">0%</td> <td align="center" nowrap="nowrap">1%</td> </tr> </tbody></table>
Figure 5. Disease prevalence, as a percent of captured fish, observed in YOY smallmouth bass captured during directed surveys at all locations within the Susquehanna River system.

Adult smallmouth bass surveys in coming years will give further indication of how the 2009 year class recruits to the older age classes and contributes to the adult smallmouth bass populations of the West Branch and main stem Susquehanna rivers.
</td> </tr> <tr> <td align="right" width="100%">
</td> </tr> <tr> <td align="right" width="100%">– Geoff Smith, Susquehanna River Biologist</td> </tr> <tr> <td align="center" width="100%"><hr size="1">
<hr size="1"></td> </tr> <tr> <td align="center" width="100%">
</td> </tr> <tr> <td align="center" width="100%">
</td> </tr> <tr> <td align="center">
</td> </tr> </tbody></table>
